How frequency and brightness change on the way out
Sandbox Physics ·
Light can reach a distant observer at a different frequency and intensity from those measured at the disk surface. A frequency shift changes the height of a spectrum and its frequency scale. Adding all frequencies introduces one more scale factor. This is why radiation calculations use a cube for specific intensity and a fourth power for total intensity.
Read Adding the spectra of differently heated rings first. We will follow one light path before adding directions across an image. You need specific intensity, the Planck shape and a frequency integral. Solving the light trajectory is a later step.
Specify the two observers
Imagine one observer moving with the orbiting gas. She measures an emitted frequency νem. A second observer far away measures νobs. Both frequencies are in hertz, but they are measured with clocks at different places and in different states of motion.
Define the dimensionless ratio
g=νemνobs.
A value below one is a redshift; a value above one is a blueshift. The ratio includes both gravity and the emitter's motion. Light emitted near a black hole can be gravitationally redshifted, and motion of the gas toward the observer can produce a strong blueshift.
Each light path has its own g. We first need its emitting position and direction. Changing the viewing angle changes which positions and projections of orbital motion contribute to the image.
Compare corresponding frequencies
Along a vacuum path with no absorption, scattering or additional emission, specific intensity divided by frequency cubed is invariant. Equations E1–E3 in Li and colleagues' Appendix E use this relation to connect local emission to a distant observer.
The two intensities must be compared at corresponding frequencies. If the received frequency is ν, the emitted frequency was ν/g. Thus
Iν,obs(ν)=g3Iν,em(gν).
The cubic factor and the horizontal shift belong together. For g=0.8, light at a chosen observed frequency came from an emitted frequency 25% higher. Multiplying the old curve's height by 0.83 without moving its frequency axis would sample the wrong part of the emitted spectrum.
For the diluted Planck emission used in the previous chapter,
The right side absorbs the shift into temperature. Along this one path, the Planck shape has an apparent colour temperature gfcolTeff. The gas's actual effective temperature still comes from local heating. A full disk combines many temperatures and shifts, so it generally has no single apparent temperature of this kind.
Where the fourth factor comes from
Let Ibol denote intensity summed over all frequencies, in Wm−2sr−1. “Bolometric” means this full-frequency total. Integrating the specific-intensity relation gives
The second line changes integration variable. Since ν=gνem, a frequency interval changes as dν=gdνem. That supplies the extra factor of g.
The cube applies to specific intensity at corresponding frequencies. The fourth power applies to the full-frequency intensity. For a finite observing band, transform its frequency limits as well as the intensity before integrating.
Worked example: looking down on an orbiting ring
Take a nonrotating black hole, circularly orbiting gas and a distant observer directly above the disk. Write r=R/rg, with rg=GM/c2. The frequency ratio is then
g=1−r3.
This includes the time dilation of the orbiting emitter. The gravitational shift for a stationary source describes a different state of motion. Equation F1 in Li and colleagues' Appendix F reduces to this result when the light path's axial angular momentum is zero.
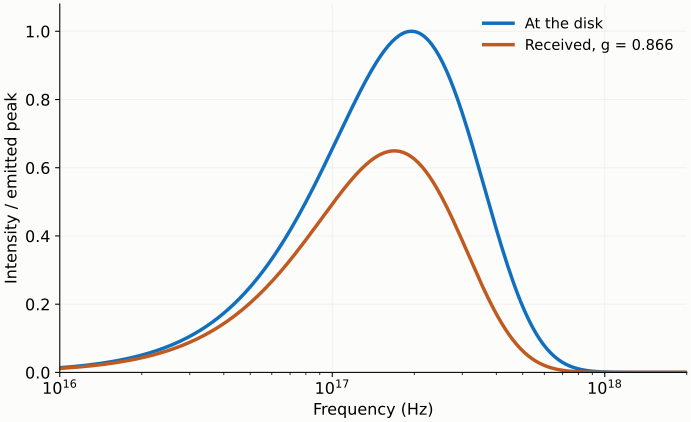
At r=12, g=3/4≈0.866. Light emitted at 1.00×10¹⁷Hz arrives at 8.66×10¹⁶Hz. The specific-intensity ratio at those corresponding frequencies is about 0.650. The full-frequency intensity ratio is 0.5625.
Total intensity falls more because the frequency axis has also contracted.
Figure 1. Single-path Planck reference, using the earlier disk with an inner edge at six gravitational radii, evaluated at twelve gravitational radii. Both curves use the emitted peak as their common normalization. Frequency has a logarithmic scale, so visible plot area is not the bolometric integral. A compact figure uses the same data on mobile.
The received flux adds the intensity from each direction multiplied by its solid angle on the observer's sky:
Fν,obs=∫Iν,obsdΩsky.
Bending changes the disk's apparent shape and area on that sky. Frequency shifts change the intensity along each path. Both effects enter the integral. Once the integration uses the observer's actual sky solid angle, an additional flat-disk cosine projection would count geometry again.
For a finite image cell, first calculate temperature, shift and intensity at each sampling direction, then sum with area weights. Averaging g first and putting that average into the Planck expression generally gives a different result. The Planck function is nonlinear in temperature.
The prescribed local emission is the Newtonian thin-disk law developed earlier; section 2 of Zimmerman and colleagues' paper supplies that temperature relation. Schwarzschild spacetime describes propagation here. The next chapter asks which part of the disk is visible when we follow a curved path back from the observer.
Exercises with explanations
1. A path has g=1/2. What fractions remain in corresponding-frequency specific intensity and in full-frequency intensity?
They are one eighth and one sixteenth. The first comparison uses corresponding emitted and observed frequencies. The second also adds over the contracted frequency range.
2. A shifted spectrum resembles a cooler Planck curve. Does that establish that the gas cooled?
Along one path, changing the frequency shift or changing local temperature can move the Planck shape. Distinguishing them requires independent information about the geometry, path or temperature. Local heating and propagation must be calculated separately.
3. For g=2, what is missed by multiplying the path's total intensity by eight?
The changed frequency width. Specific intensity at corresponding frequencies rises eightfold; full-frequency intensity rises sixteenfold. The blueshift also changes where the energy falls in frequency.
4. Transfer problem: must a disk become dimmer in proportion to a cosine as it turns closer to edge-on?
Straight-path, isotropic flat-disk emission gives that projection rule. Near the black hole, bending and orbital frequency shifts also change the image. Calculate the intensity along each path, then integrate over the same sky aperture to include projection, bending and frequency shifts together.