Identify the three observations
P Cygni is HD193237. SWP36331 was observed on 23 May 1989 for 2999.781 seconds; LWP15586 followed on 24 May for 239.493 seconds. They cover different ultraviolet bands. Their dates are close, but they are not a simultaneous exposure of the same spectrum.
LWP04483 is a separate long-wavelength observation from 2 October 1984, exposed for 299.704 seconds. Use it to inspect change between epochs. Verify the complete bytes and SHA before reading the target, observing date, exposure and processing date from the header. A NEWSIPS processing date in 1997 is not another observing epoch.
The science archive contains these small complete public mission products and independent Python programs. It retains the NASA, ESA and UK IUE mission and STScI/MAST acknowledgments; no spectral-library download is needed.
python3 replay.py --inputs input --out-dir rerunReading: IUE NEWSIPS manual, high-dispersion MXHI format · MAST original mission data use
Decode a row as an entire spectral order
After the primary header comes a binary table. Each row represents a high-dispersion echelle order and has 17 fields. Flux, noise and quality vectors are padded to 768 elements. SWP36331 contains 60 native orders, each requiring its own wavelength construction.
Read ORDER, WAVELENGTH, STARTPIX, DELTAW and NPOINTS together. STARTPIX is one-based: it locates the native pixel to which the starting wavelength belongs. Counting from vector element zero shifts every wavelength by a pixel increment.
ABS_CAL is calibrated energy flux in ergs per square centimetre per second per Angstrom. NOISE instead has FN units, belonging to another calibration stage. QUALITY stores bit flags in signed integers. Using the FN vector as a physical standard deviation for ABS_CAL would assign incorrect statistical weights.
Leave rejected pixels as gaps
Our declared selection keeps points inside the extracted interval with zero quality flags and finite, nonzero ABS_CAL. Rejected positions remain gaps in the plot. Do not connect across them or discard every valid negative flux value.
In the two eight-Angstrom silicon candidate windows, orders 99 and 98 contain 224 and 221 native samples. The strict selection retains 207 and 206. These counts make the rule reproducible; they do not certify every surviving pixel as uncontaminated.
The IUE FAQ states that high-dispersion NEWSIPS does not automatically remove cosmic rays. An anomalous point can still have a zero quality flag. A full pixel-by-pixel cleaning would require the two-dimensional spectral images, which are outside this exercise. Spikes, backgrounds and overlapping-order differences remain diagnostic clues.
Reading: IUE data-analysis FAQ · IUE NEWSIPS manual, high-dispersion MXHI format
Keep the wavelength frames separate
NEWSIPS wavelengths are already vacuum and heliocentric. Inverting the NIST magnesium level wavenumbers gives laboratory vacuum references near 2796.3543 and 2803.5315 Angstrom. Substituting air wavelengths or applying the heliocentric correction again displaces the line.
Define velocity relative to the stated laboratory wavelength with redshift positive. This coordinate still includes the systemic velocity of the star. LRADVELO records a pipeline velocity correction; it is not a measured stellar systemic velocity.
A laboratory zero and a wind velocity relative to its star are therefore separate quantities. Ionization extent, turbulence, interstellar absorption and overlapping lines can also affect a blue edge. The leftmost depression does not by itself identify the asymptotic terminal speed.
Reading: IUE NEWSIPS manual, high-dispersion MXHI format · NIST magnesium energy levels
Check the chosen continuum
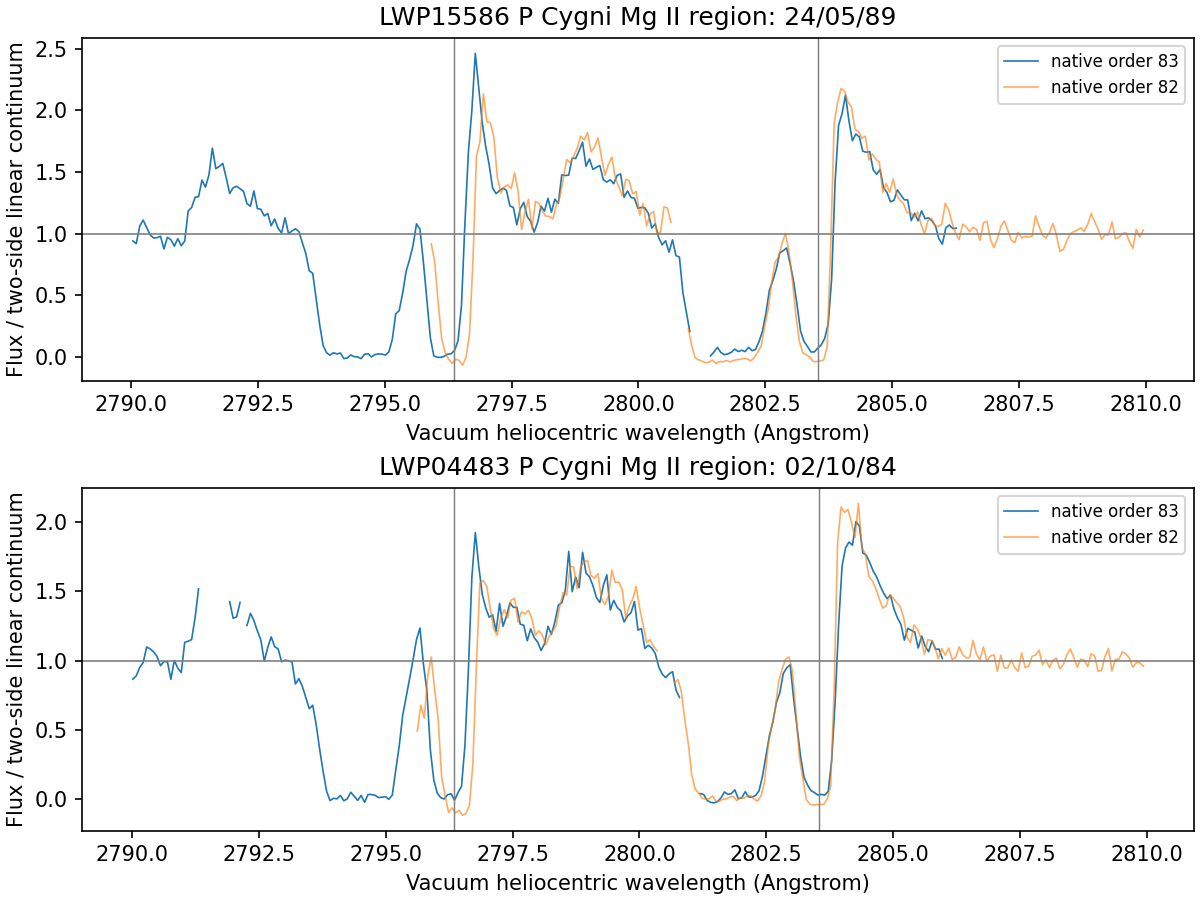
For magnesium, take the median quality-zero flux in 2789–2791 Angstrom from order 83 and in 2808–2810 Angstrom from order 82, then join the two anchors with a straight line. The 1989 anchors contain 30 and 29 samples; the 1984 anchors contain 29 and 29.
This is a reproducible local baseline, not a claim that either window reveals an immaculate stellar continuum. Line blanketing, extraction and calibration may affect it. The first attempt sought both anchors in one order and found no valid red anchor. That failed output and figure are retained; the final calculation explicitly uses the two named orders.
Repeat with a constant baseline equal to the linear baseline at 2799 Angstrom. In some red-component windows the normalized profile changes by about 0.13 continuum units. Report this processing sensitivity separately from independent observations and statistical standard deviations.
Reading: IUE data-analysis FAQ · Standalone stellar-wind scientific reproduction
Plot orders and epochs separately
Run probe-observation.py and inspect both magnesium panels. Each epoch retains orders 83 and 82 as separate curves with their native quality gaps. Do not silently average the overlap.
The two orders come from the same exposure and may share calibration errors. Their disagreement tests robustness; it does not supply two independent repetitions that automatically improve precision. Keeping 1984 and 1989 in separate panels also preserves stellar variability.
The silicon windows are plotted separately. For these more complicated line and absorption structures, the exercise identifies candidate lines and inspects baselines. A quantitative fit would need a richer transfer model.
python3 probe-observation.py --inputs input --out-dir rerunReading: IUE NEWSIPS manual, high-dispersion MXHI format · Standalone stellar-wind scientific reproduction
Recompute a conditional isolated-line reference
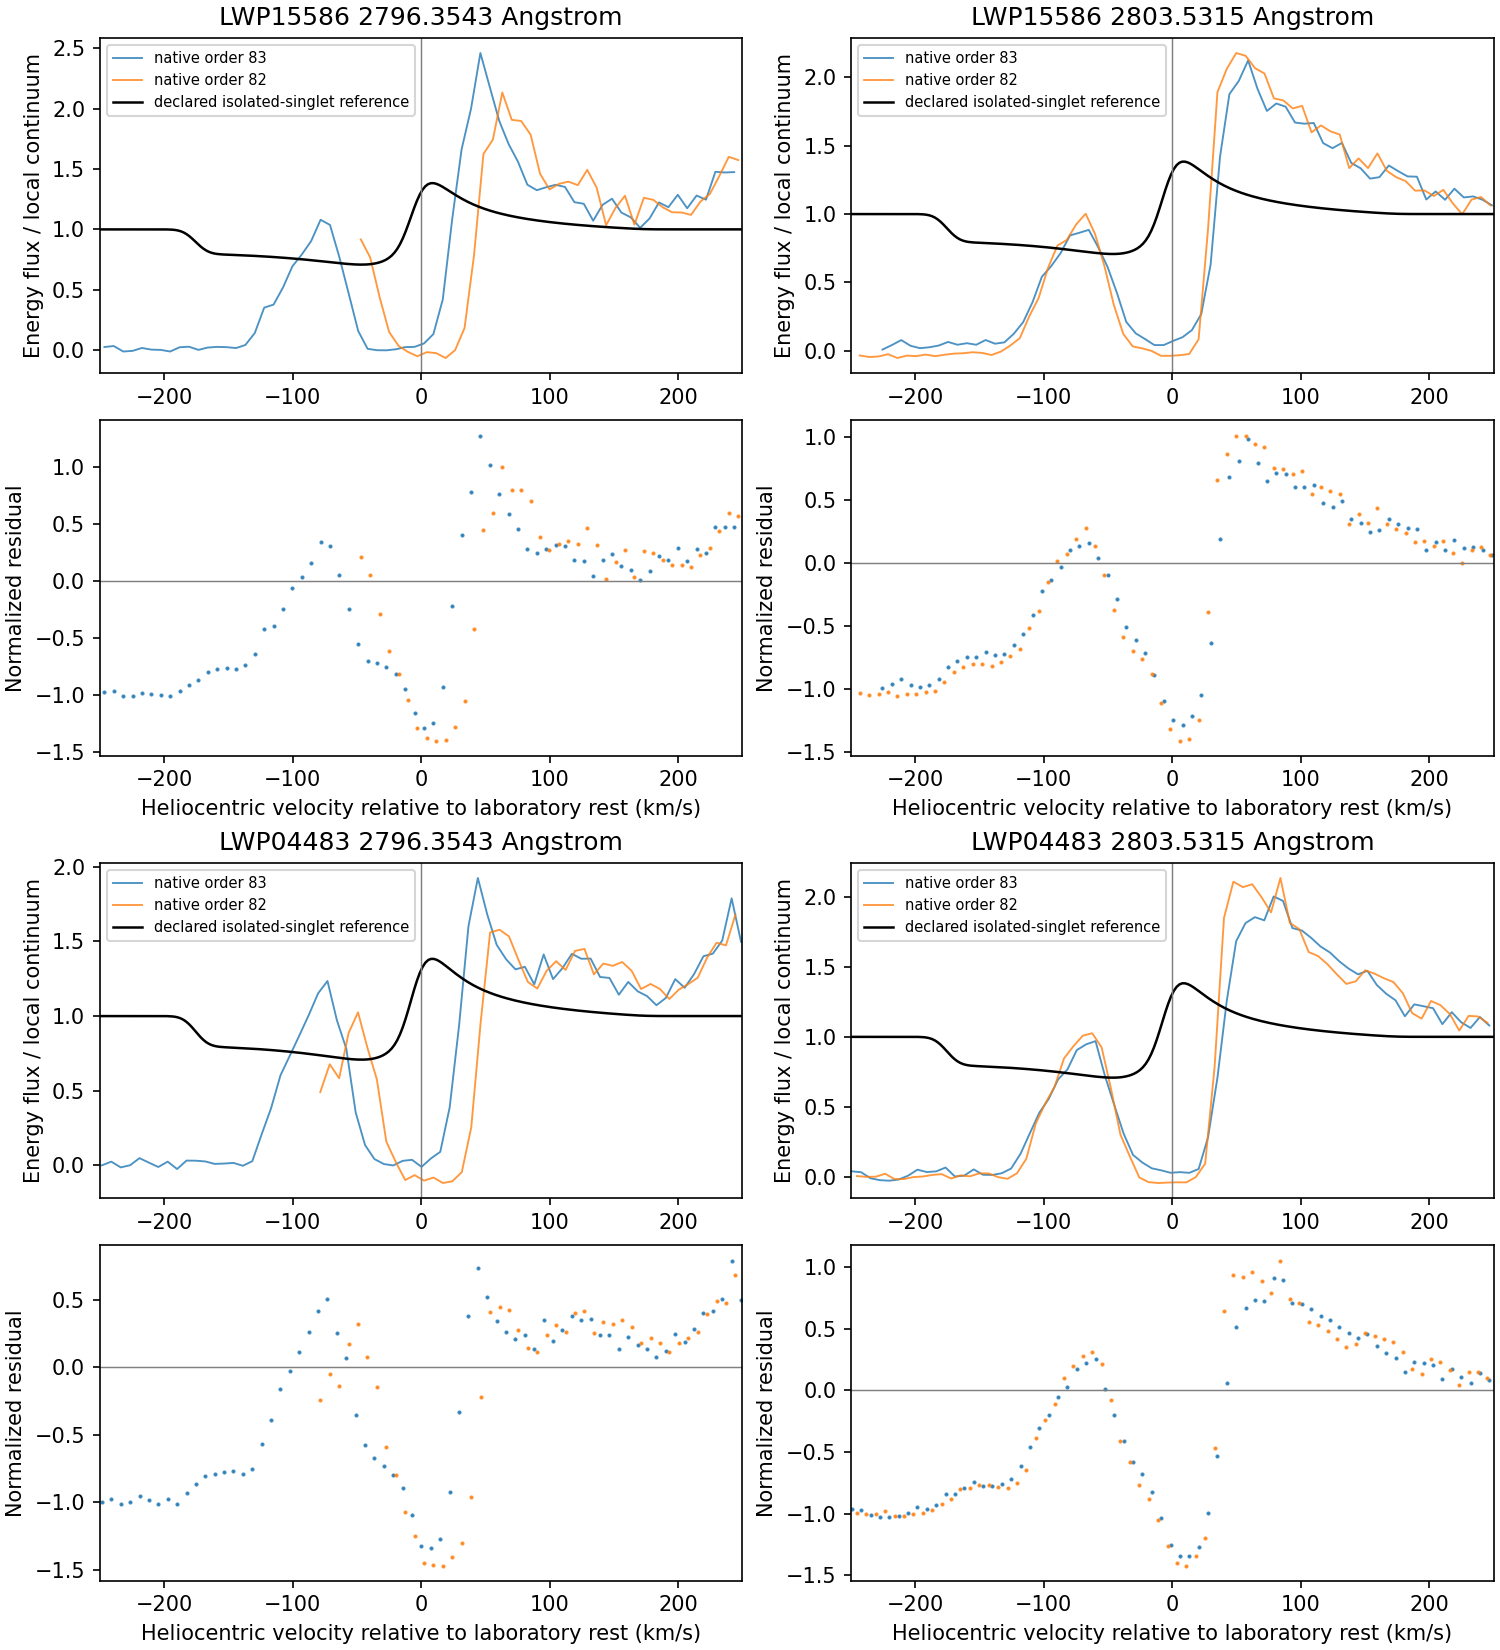
compare_real_line_shapes.py computes an isolated singlet with asymptotic speed 200 kilometres per second, velocity exponent one, product parameter one, full aperture and illustrative instrumental standard deviation 8 kilometres per second. That width was not calibrated from IUE. No parameter optimization makes this a reported best fit.
Compare each magnesium component in its own window extending 250 kilometres per second either side of the laboratory reference. We do not add two isolated-line profiles and call the sum doublet transfer. The reference wind reaches 176.25 kilometres per second at its finite outer boundary; the stated window and width keep its reference components isolated. Blends in the real observation can remain.
Converting an energy spectrum into photons per velocity interval introduces a wavelength factor and the coordinate Jacobian. If the measured flux and local continuum are converted consistently, these factors cancel in their ratio. This permits a normalized-profile comparison while preserving the physical distinction between a structured stellar continuum and the model’s flat illumination.
The program saves eight epoch/order/component comparisons. For the 1989 blue component in order 83, the normalized RMS residual is about 0.66: this ideal reference describes the observed shape poorly. Its residuals can help locate missing photospheric background, interstellar absorption, ion populations, systemic velocity or instrumental effects. They are not a chi-square statistic or a mass-loss uncertainty.
python3 compare_real_line_shapes.py --inputs input --out-dir rerunReading: Standalone stellar-wind scientific reproduction · Lamers, Cerruti-Sola & Perinotto1987, the SEI line-profile method
Why the synthetic count intervals do not transfer
The previous chapter had saved integer photons, a known continuum and instrument, fixed geometry and independent priors from 0.5 to 2 for the mass-flow and ionization multipliers. Even under those conditions a single line identifies their product.
In three fixed-truth experiments with 100 records each, the mass-flow intervals covered 100, 100 and 0 times. In the last case a truth near the prior boundary is repeatedly excluded by the central interval along a broad degeneracy ridge. Interpret that failure alongside prior-averaged coverage. A prior-shaped broad interval is not a precise measurement of mass loss.
The IUE products do not directly supply even the physical count-error model of that synthetic exercise. Retain their calibrated energy flux and FN noise identities. The reproducible work supported here is a comparison of shapes, native orders and continuum sensitivity.
Reading: Standalone stellar-wind scientific reproduction · IUE NEWSIPS manual, high-dispersion MXHI format
Leave a route another reader can replay
Extract into an empty directory, install the pinned NumPy, SciPy and Matplotlib requirements, then run replay.py. It checks input bytes and hashes before actually recomputing transfer, photon fates, force diagnostics, count inference, IUE profiles and the published-table comparison. A receipt is written only after all required steps succeed.
Carry five questions to another spectrum: which wavelength frame, which quality selection, which noise units, which continuum and which fixed physical assumptions? Each answer should point to a saved field or a computation that someone else can inspect.
Reading: Standalone stellar-wind scientific reproduction · MAST original mission data use