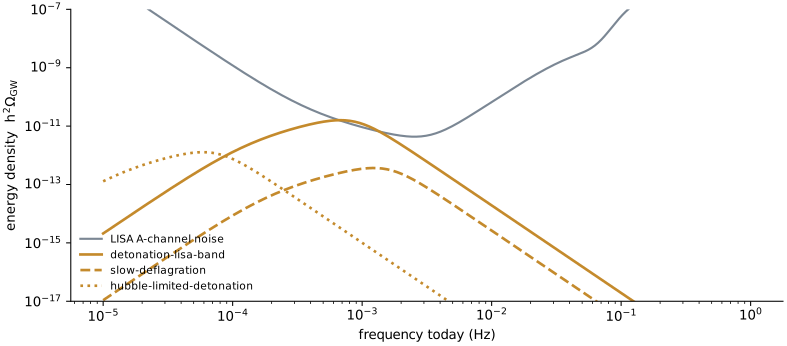
The sound-wave spectrum is fixed by four numbers: the kinetic fraction K, the bubble size H∗R∗, the wall speed and the temperature. For the benchmark α=0.2, β/H∗=50, ξw=0.9, T∗=200GeV, sound lasts 0.368 Hubble times before shocks form, and the spectrum today peaks at h2Ω=1.60×10⁻¹¹ near 0.677mHz.
How long the sound lasts
Sound waves of amplitude vˉf steepen into shocks after about the time it takes the fluid to move one wavelength. The wavelength is set by the bubble size, so the shock-formation time is τsh∼R∗/vˉf. After that, the flow turns into shocks and turbulence and the template stops counting it as sound.
The 2024 template uses vˉf2=K/Γ, with adiabatic index Γ=4/3 for radiation, and caps the duration at one Hubble time because expansion dilutes the source after that.
Worked example. K=0.0274 gives vˉf=0.0274×3/4=0.143. With H∗R∗=0.0527, H∗τsh=0.368. The sound breaks up after about a third of a Hubble time. For the weak benchmark with α=0.05 and β/H∗=10, H∗τsh=7.1, and the cap of 1 applies.
H∗τsw=min[K/ΓH∗R∗,1]
Ellis, Lewicki and No (2020) argued that for many models the first entry is smaller than 1. Guo, Sinha, Vagie and White (2021) instead derived a smooth suppression factor Υ=1−1/1+2H∗τsh for radiation domination; for the benchmark it gives 0.241 instead of 0.368. The Lab plots both, and uses the minimum rule because the template was calibrated with it.
The spectrum rises as f3 at low frequency, runs as f1 between two breaks and falls as f−3 above the second; the 2024 paper takes these exponents from fluid simulations. The first break is set by the bubble size and the second by the sound-shell thickness, so both scale as 1/R∗.
The integrated amplitude Ωint is the spectrum integrated over lnf. It grows as K2, with the source duration and with the bubble size. The constant Asw=0.11 is an average over simulations at different α and ξw.
We checked the normalisation independently. Integrating the shape numerically over lnf for the benchmark ratio f2/f1=6.97 reproduces the printed relation between Ω2, the amplitude at the second break, and Ωint to better than one part in a million, and gives Ω2/Ωint=0.540.
Here Δw=ξshell/max(ξw,cs). For the benchmark Δw=(0.9−0.577)/0.9=0.358. The constants FGW,0 and H∗,0 carry the redshift and are derived in the next section.
Ω2=π1(2+1+f22/f122f2/f1)Ωint
Equation Om2_sound of arXiv:2403.03723v2. The paper quotes ≈0.55 for ξw≈1; at ξw=0.9 the ratio is 0.540.Template spectra h2ΩGW(f) today for the three tutorial benchmarks, computed by the tutorial script. Grey is the LISA noise written as an energy density, with the optical-metrology corner at 2mHz. These are evaluations of a parametric template, not simulations or measured data. Open the full figure
A wave produced with frequency f∗ is observed today at f=f∗a∗/a0. Entropy per comoving volume is conserved, so gsa3T3 is constant, giving a∗/a0=(gs,0/gs,∗)1/3T0/T∗ with gs,0=3.909 and CMB temperature T0=2.7255K. The Hubble rate during radiation domination follows from the Friedmann equation.
Multiplying gives H∗,0. Our own evaluation with these constants gives 1.6467×10⁻⁵Hz at 100GeV and g∗=100, within 0.2 percent of the printed 1.65×10⁻⁵. The energy density of radiation falls as a−4 while the critical density falls as H2; the ratio gives h2FGW,0=1.6404×10⁻⁵, against the printed 1.64×10⁻⁵.
Putting the benchmark together: H∗,0=3.30×10⁻⁵Hz at 200 GeV, f1=0.125mHz, f2=0.873mHz, h2Ωint=2.63×10⁻¹¹, and a peak of 1.60×10⁻¹¹ at 0.677mHz.
MPl=1.22×10¹⁹GeV is the Planck mass. We assume gs,∗=g∗, as the template does. Temperature only shifts the spectrum in frequency; it does not change h2Ω at fixed g∗.
The template is compared with LISA noise expressed in the same units. We use the two-parameter noise model of the 2024 paper: test-mass acceleration noise 3×10⁻¹⁵ms−2Hz−1/2 and optical metrology noise 15×10−12mHz−1/2, in the A and E channels. No galactic or extragalactic foreground is included.
The signal-to-noise ratio for four years of data is SNR=2T∫(Ω/ΩN)2df, with the factor 2 for the two channels. The benchmark gives 634, the slow-wall benchmark 33.7 and the Hubble-limited weak transition 0.20.
As an independent check of the noise curve, the sky-averaged sensitivity of Robson, Cornish and Liu should exceed our single-channel curve by a factor tending to 20/9 at low frequency, because their curve uses a sky-averaged response and a different normalisation. Our numbers reproduce that limit, which checks the units and the low-frequency acceleration term.
Keep everything in the benchmark fixed but raise the temperature to 1 TeV. What happens to f1, f2 and the peak height?
Read the explanation
Both breaks scale with H∗,0∝T∗, so they move up by a factor 5: f1=0.626mHz, f2=4.36mHz. The height h2Ω is unchanged at fixed g∗, because FGW,0 depends only on g∗.
For the weak benchmark, H∗τsh=7.1. Why does the template use 1 instead, and what would the amplitude be without the cap?
Read the explanation
After about one Hubble time, expansion has diluted the source and the sound waves no longer add coherently to the gravitational-wave energy at the same rate. Without the cap the amplitude would be 7.1 times larger. The smooth factor Υ=0.744 of Guo et al. gives a value between the two estimates.
Ellis, Lewicki and No use Uˉf2=43κα/(1+α). Compute H∗τsh for the benchmark with that definition and compare.
Read the explanation
κα/(1+α)=0.0457, so Uˉf=0.0343=0.185 and H∗τsh=0.0527/0.185=0.285, against 0.368 with the 2024 definition. The difference is the factor 0.6 in K. Two papers that agree on the physics still give source lifetimes that differ by 30 percent here.
Read in the arXiv v2 LaTeX source: abstract and introduction, section 2.2.1 (sound-wave double broken power law, amplitude, mean bubble separation and redshift factors), section 3 and appendix A (two-parameter LISA noise and response) and the opening of section 5 on reconstruction. The noise equation prints the optical-metrology corner as 2e-3 mHz; our materials use 2 mHz and report both results. Figure 2 was read from its caption only.
Read the LaTeX source in two places: the sound-wave signal section (signal.tex, about lines 180 to 260) and the definition of the root-mean-square fluid velocity and kinetic-energy fraction (prelim.tex, lines 171 to 182). Used for the earlier shock-time definition only.
Read the LaTeX source for the shock-formation time, the mean fluid velocity written through the efficiency, and the argument that the sound-wave source switches off well before a Hubble time for strong transitions.
Located the optical-metrology and test-mass noise terms and the sensitivity formula in the LaTeX source. Used only as an independent check of the noise curve shape and of the 2 mHz corner; the paper was not read section by section.
Our script, three fixed benchmarks, four failure cases and the expected output. It evaluates the published parametric template, the efficiency fits and the noise model; it does not solve the Einstein or fluid equations and contains no browser Engine code, paper text or LISA data.
Keep reading
What this page links to directly
You are hereFrom the sound lifetime to the spectrum today