What the Tilt, Tensors and Squeezed Triangles Measure
Sandbox Physics ·
Three numbers carry most of what observations say about single-field inflation: the tilt ns, the tensor-to-scalar ratio r and the squeezed-limit three-point amplitude. This chapter derives each one, compares the Lab’s numerical values with their slow-roll estimates and states which published limits they face.
The tilt measures how fast the freezing conditions change
Define ns−1=dlnPR/dlnk. Each k freezes when k=aH, and dlnk=(1−ϵ)dN there, so the tilt measures how quickly H2/ϵ changes per e-fold. To leading order in the potential slow-roll parameters this gives the expression below.
Worked example on the plateau at ϕ∗=5.3213: ϵV=2.30×10⁻⁴ and ηV=V,ϕϕ/V=−0.0173, so ns≈1−0.0360=0.9640. The numerical spectrum, differenced between 0.049 and 0.051Mpc−1, gives 0.96490. Leading order is good to about 10−3 here.
For the R2 plateau, Planck 2018 X equation 48 quotes the lowest-order results ns−1≃−2/N and r≃12/N2. At N∗=55 these give 0.9636 and 0.00397; the full calculation gives 0.9649 and 0.00355. The formulas are lowest order in 1/N, and our N counts to ϵ=1.
For 21m2ϕ2, ϵV=2/ϕ2 and inflation ends near ϕ2=2, so ϕ∗2≃4N+2. Then ns−1≃−2/(N+21) and r≃8/(N+21): 0.9640 and 0.144 at N=55. The numerical values are 0.9634 and 0.1440.
Both match Planck’s tilt. They differ by a factor of forty in r, which is what separates them.
Gravitational waves freeze like the curvature ripple but with friction 3−ϵ. At leading order r=Pt/PR≃16ϵ, so r measures the slope of the potential, and through H the energy scale of inflation.
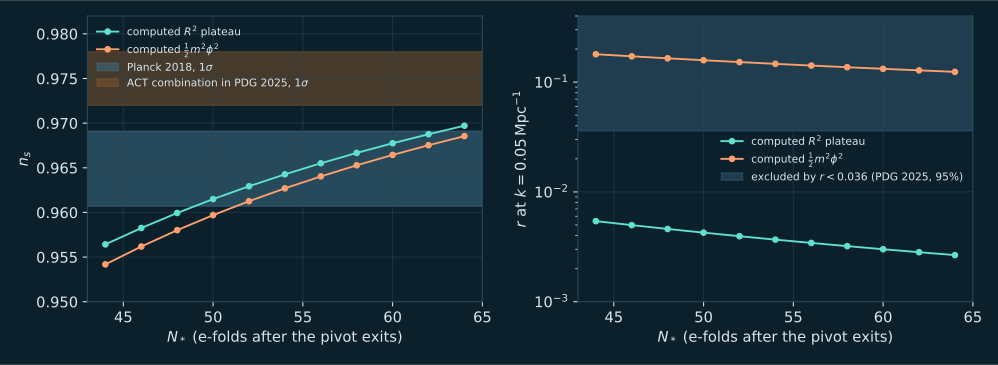
PDG 2025 quotes r<0.036 at 95% confidence from BICEP, Keck Array and Planck data. The quadratic model gives 0.124 to 0.179 for N∗ between 64 and 44, three to five times too large, as the right-hand panel shows. The plateau sits well below the bound.
Always check the pivot. Planck 2018 X quotes r0.002<0.056, at k=0.002Mpc−1. For the plateau our r is 0.00318 there and 0.00355 at 0.05Mpc−1. The Lab reports the value at 0.05Mpc−1, because a large-scale step can distort r0.002.
Points are our numerical spectra for the R2 plateau and 21m2ϕ2, with ns from a finite difference at k=0.05Mpc−1. Bands are transcribed: Planck 2018 ns=0.9649±0.0042; the ACT combination 0.975±0.003, which PDG 2025 says is not yet a full joint analysis; and the PDG 2025 bound r<0.036 at 95% confidence. Open the full figure
How many e-folds N∗ separate the pivot’s exit from the end of inflation depends on the expansion history afterwards, including reheating. PDG 2025 notes that the uncertainty in ns is comparable to the spread of many model predictions for N∗ between 50 and 60.
The left panel makes this concrete. On our grid the plateau runs from ns=0.9564 at N∗=44 to 0.9697 at N∗=64. It stays inside the Planck 1σ band for roughly N∗ from 49 to 63. The Lab’s shorter-reheating preset, N∗=46, gives 0.9583.
So a tilt measurement constrains the potential and the post-inflation history together. That degeneracy returns in the reading guide.
The three-point function ⟨ζζζ⟩ depends on a triangle of wavenumbers. In the squeezed limit k1≪k2≃k3, the long mode froze long before the short ones. To them it is a constant rescaling of coordinates, which shifts their power by the tilt.
That gives the first relation below, the argument of Maldacena’s equation 1.2. Creminelli and Zaldarriaga showed it holds for any single-field model. With the sign convention used by Planck and PDG, which amounts to ζ=ζg+53fNLζg2, the local template has squeezed limit 512fNLP(k1)P(k2). Matching the two gives fNL=5(1−ns)/12.
For ns=0.9649 this is 0.0146. Planck 2018 IX measured fNLlocal=−0.9±5.1, so the single-field value is about 350 times smaller than the error bar. A clear detection of a local signal near 1 would therefore point beyond a single field.
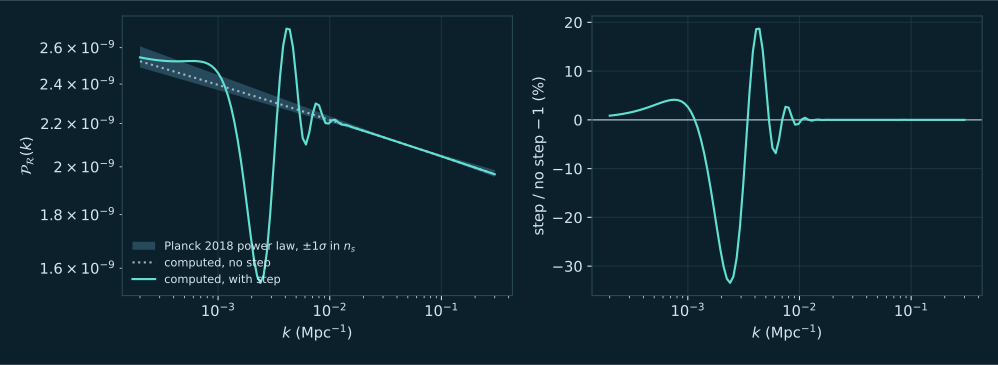
The Lab evaluates 125(1−ns(k)) with the local tilt of the computed spectrum at each short-mode k. On the smooth plateau it stays below 0.02. With the default step the local tilt swings, and the largest value reaches −0.651; the exaggerated sharp step reaches 3.93.
This is a restricted bispectrum: only the squeezed limit, and only through the consistency relation. Triangles with comparable sides need the full cubic interaction and are not computed. It covers only this limit of the step’s three-point signal. Even so, it shows that a feature in the spectrum must also appear in squeezed triangles.
Our calculation on 110 wavenumbers for the Lab’s default step (c=2×10⁻⁵, crossed 59 e-folds before the end) and for the same plateau without it, both scaled so the smooth curve meets As=e3.044×10−10 at k=0.05Mpc−1. The shaded band is the Planck 2018 power law with ns=0.9649±0.0042, an ideal reference rather than a fit to these curves. Open the full figure
Use the leading formulas to predict ns and r for 21m2ϕ2 at N=60, then compare with the numerical 0.96644 and 0.1322.
Read the explanation
ns≃1−2/60.5=0.96694 and r≃8/60.5=0.1322. The tensor ratio matches to four digits; the tilt is off by 5×10⁻⁴, the size of the next-order terms.
If the ACT combination ns=0.975 were right, what squeezed amplitude would single-field inflation predict?
Read the explanation
fNLsq=5×0.025/12≈0.0104. It is smaller than for Planck’s tilt and still far below any foreseeable error bar.
For the plateau at N∗=46, the formula 1−2/N gives 0.9565, while the numerical tilt is 0.9583. Which is more trustworthy, and why do they differ?
Read the explanation
The numerical value: it solves the mode equation without slow-roll truncation. The formula is lowest order in 1/N, and the correction grows as N falls, so the gap at N=46 is larger than at 55.
A step raises the Lab’s largest squeezed amplitude to −0.651. Does that contradict Planck’s −0.9±5.1?
Read the explanation
No. The Lab’s number is the largest value at a single scale, while Planck’s local template assumes a scale-independent fNL and averages over many triangles. A fair comparison projects the scale-dependent bispectrum onto that template first, a step beyond the Lab’s squeezed readout.
Choose Smooth plateau. The squeezed chart lies just above zero, inside the Planck band.
Choose A step rings the spectrum. Each place where the spectrum rises steeply with k becomes a negative squeezed value, and each falling stretch a positive one.
Choose Steep slope, strong gravitational waves and read the tensor ratio: about 0.144, well above 0.036.
Full v2 PDF (2 August 2019) read for Sections 4.2 and 7.1–7.3: equations 47–48, the step template in equations 57–62, Table 11 priors, Table 12 step results and Figure 28. The headline spectral index and amplitude quoted in this course come from its parameter tables.
Full v1 PDF read for Sections 2.1–2.2 (equations 1–3, written for the Bardeen potential rather than the curvature perturbation), Table 5 final SMICA T+E values after lensing-ISW subtraction, and Table 10 feature-model peak statistics with the look-elsewhere correction.
Full review read. Used: Section 23.3.4 equations 23.55–23.57 and its sentence on the ACT combination, Section 23.6 on reheating and the number of e-folds after the pivot exits, and Section 23.7.3.2 equations 23.101–23.103 for the sign convention of the local non-Gaussian amplitude and its single-field squeezed-limit value.
Full v5 read. Equation 1.2 gives the squeezed-limit argument. In that paper the tilt symbol means the deviation from scale invariance, which modern papers write as the spectral index minus one.
Full v2 read. Equation 1 states the consistency relation for any single-field model. Equation 5 defines the local non-Gaussian amplitude with the opposite sign to Planck and PDG; we use the PDG sign and do not use or rewrite equation 6.
Our own calculations: the Lab integrator and a separate NumPy/SciPy reference agree to better than three parts in ten thousand on all five presets. The ZIP holds the Python reference, closed-form benchmarks, five inputs and expected outputs. No Engine code and no paper text is included.
Keep reading
What this page links to directly
You are hereWhat the Tilt, Tensors and Squeezed Triangles Measure