Choose the object before examining the answer
The target is SDSS J030335.42−002001.1, identified from the published quasar table of Chen and colleagues. Its published identity fixed the selection before the forest statistics were calculated. The fixed spectrum identifiers are plate 2068, MJD 53386 and fibre 316, with reduction label run2d 26. The materials record its exact URL, length and SHA-256 so that a replacement reduction cannot silently change the input.
This FITS file contains exposures combined after instrumental reduction and calibration. It does not contain raw CCD counts. It contains 3,812 coadded pixels. The pipeline classifies the object as QSO, gives redshift about 2.6945615 and reports ZWARNING zero. The paper table gives an approximate 2.72; wavelength conversions below consistently use the value stored in this file.
Read column definitions before calculating. SDSS loglam is the base-ten logarithm of vacuum, heliocentric wavelength in angstroms. Flux is in units of erg per square centimetre per second per angstrom. The inverse variance, ivar, uses the reciprocal squared flux unit. This file does not supply every required unit through column TUNIT metadata, so the official format description is part of the input interpretation.
Reading: Chen et al. (2017), published quasar target table: SDSS J030335.42−002001.1 · SDSS DR17: Spectroscopic Data Basics · Fixed SDSS continuum and flux-statistics exercise
Give wavelength and masks distinct jobs
Divide observed wavelength by one plus the quasar redshift to define the quasar rest frame. The fixed forest window is 1040–1180 angstroms in that frame. It avoids the region close to the quasar’s Ly-alpha emission, but a wavelength cut alone does not identify and remove all metal or strong hydrogen absorbers.
Foreground hydrogen has its own redshift. Interpreting a pixel as Ly-alpha absorption assigns its observed wavelength divided by 1215.67 angstroms, minus one. The chosen forest spans approximately absorber redshifts 2.16–2.59. Assigning every absorber the quasar’s redshift would place the gas incorrectly.
The default selection requires finite wavelength, flux and inverse variance, positive inverse variance, and and_mask equal to zero. The SDSS AND mask combines flags shared across contributing exposures; OR retains flags present in any exposure. Their meanings differ. AND zero is not a promise that every possible contaminant is absent.
The fixed rule retains 548 forest pixels and excludes one. Requiring or_mask zero instead retains 359. We keep that stricter selection as a sensitivity test. Its average describes the newly selected pixel set.
Reading: SDSS DR17: Spectroscopic Data Basics · Fixed SDSS continuum and flux-statistics exercise
Estimate the light that would have arrived without absorption
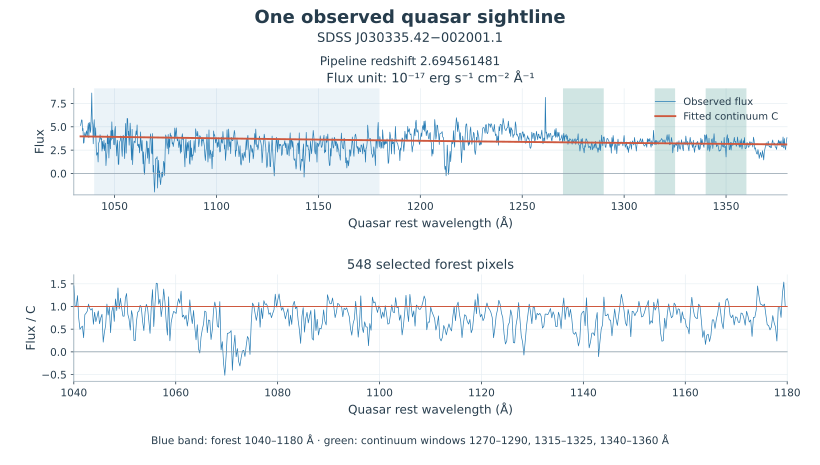
Transmission needs a denominator: the continuum flux the quasar would have supplied without this absorption. The observation does not directly measure that missing background. We fit a simple power law using three fixed quasar-rest-frame windows: 1270–1290, 1315–1325 and 1340–1360 angstroms. These redward windows anchor an extrapolation into the forest.
The windows retain 166 pixels. Inverse-variance weighting gives amplitude about 3.31429 at 1280 angstroms, in the original flux unit, and slope about −0.846066. An independent solver profiles out amplitude analytically at each slope, then performs a one-dimensional search. Its parameters agree with the two-dimensional least-squares solution to relative error below four parts in a billion.
That agreement checks the solution of the stated fitting problem. It does not establish the power law as the true unabsorbed continuum. The weighted residual sum is about 288.862 for nominally 164 degrees of freedom. Pixel correlations, emission structure and model mismatch are not fully included, so it is not converted into a certified goodness-of-fit probability.
In the figure, the continuum crosses the three redward fitting windows and extends into the forest. The assumed denominator is now visible alongside the measured flux.

Keep the noisy ratios before averaging
The arithmetic mean over 548 retained pixels is 0.7461836. Sample variance is about 0.0996164. Temporarily treating the continuum as fixed and neglecting pixel correlations, the average diagonal noise variance divided by continuum squared is about 0.0355552. Subtraction gives about 0.0640612. This is a conditional noise correction, not a direct measurement of intrinsic cosmic gas variance.
There are 13 ratios below zero and 109 above one. Physical transmission lies between zero and one, but noisy flux, background subtraction and continuum estimation need not respect that interval. Clipping the observed ratios would change their mean, variance and distribution. The distribution uses 20 bins between −0.5 and 1.5, with one underflow and three overflow pixels reported separately.
Effective optical depth takes the negative logarithm after averaging, giving about 0.292784. Averaging individual negative logarithms is a different operation and is undefined over the real numbers for negative pixels.
The OR-zero mask gives mean 0.767696 and effective optical depth 0.264362. This difference records sensitivity to selection. Statistics belong to the particular pixels retained.
Move an assumption deliberately
Multiply the estimated continuum by 0.95 without changing observed flux. Mean transmission rises to about 0.785456 and effective optical depth falls to 0.241490. Multiplying by 1.05 gives mean 0.710651 and effective optical depth 0.341574. Raising the expected background makes the same received light appear more strongly absorbed.
Five percent is a chosen sensitivity perturbation, not a data-derived one-sigma uncertainty. Subtracting or adding 0.3 to the fitted slope gives means about 0.714569 and 0.779293. Amplitude and slope errors affect the extrapolated blueward continuum differently.
High signal-to-noise cannot replace checks of the object and continuum. If the mean ratio exceeds one, inspect emission structure, redshift and the continuum windows. A background estimate or target-identification problem may be exposed. Clipping the mean at one would hide that diagnostic.
Hand a reproducible result to the next physical question
Check file hash, units, redshift, windows, masks, continuum parameters and retained count before comparing the final statistics. The download supplies our calculation, input manifest and expected results. Running the script generates the derived pixel table. Fetch the original FITS separately from the named SDSS source. Reproduce the fixed example before substituting another object.
This result describes one sightline, one window and one continuum model. It does not include a complete instrument line-spread function, pixel covariance, metal rejection, damping-wing/BAL treatment or continuum covariance. Those omissions matter for gas temperatures and dark-matter inference.
The prescribed gas screen in the accompanying calculation sits at redshift three; these observed absorbers are at lower redshift. Similar mean fluxes would not constitute a fit. A physical inference must align simulated redshift, instrumental treatment, selection and statistical windows with the observations being explained.
Reading: SDSS DR17: Spectroscopic Data Basics · Fixed SDSS continuum and flux-statistics exercise