Why equal temperatures today are insufficient
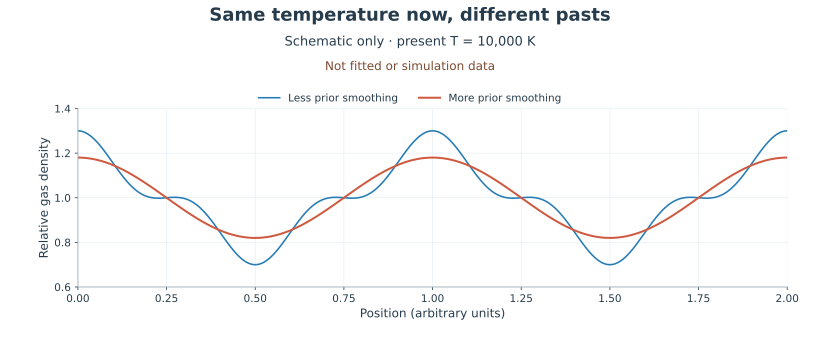
Consider two patches at the same present temperature. One was heated early, leaving pressure more time to redistribute small structures; the other was heated recently. Their instantaneous atomic thermal motions can be similar while their density and bulk-motion structures differ. Current thermal broadening and accumulated pressure response are separate physical effects.
Thermal broadening spreads each location’s absorption across velocity. Pressure smoothing changes how gas has distributed itself and moved. Dark-matter free streaming can also reduce small-scale structure, through a different stage. Early particle motion suppresses small matter perturbations; gas pressure reshapes baryonic structure, while current thermal broadening acts when gas is mapped into a spectrum. All can reduce fine structure in flux; a smoother spectrum alone does not identify which one is responsible.
Peeples and colleagues compared pressure support with thermal broadening and showed how the temperature–density relation affects their relative appearance in longitudinal statistics. The new preprint focuses on a velocity-gradient feature and proposes a bridge to observable flux power. Keep those questions distinct before interpreting a turnover in a plot.

Reading: Peeples et al., Pressure Support versus Thermal Broadening in the Lyman-alpha Forest, arXiv:0910.0256v3 · Iršič et al., Ringing of the Reionization, arXiv:2607.19938v1
Identify the velocity quantity being plotted
The paper uses the line-of-sight peculiar-velocity gradient normalized by expansion, denoted . Peculiar velocity is motion relative to the overall expansion. Its gradient describes differences between neighbouring locations. The minus sign is a convention under which line-of-sight compression gives a positive variable.
Match viewing direction, comoving derivative, scale factor and expansion rate before comparing panels. A velocity gradient is not velocity itself. Calling its power spectrum a directly observed map of gas velocities would skip the process that converts gas into a spectrum.
Power spectra separate fluctuations by wavenumber: larger wavenumber means finer structure. Some panels multiply power by the seventh power of wavenumber to expose a high-wavenumber turnover or oscillatory feature. That display weighting changes which features stand out; the underlying power is the same. Read the actual ordinate when comparing amplitudes.
Appendix B discusses the toy model’s density-weighted radial velocity. It differs from a material trajectory’s instantaneous velocity. Animating that constructed curve as particles flying through space would add a dynamical interpretation the paper does not establish.
Reading: Iršič et al., Ringing of the Reionization, arXiv:2607.19938v1
Follow the inference chain before the last fit
First identify what differs between simulated histories. The timing and progress of reionization heating affect subsequent pressure response. A label for the end of reionization dates the earlier heating history. The forest observation has its own redshift. The comparison can hold observation time fixed while changing the earlier evolution.
Next inspect velocity power. In a linear or simplified response picture, pressure produces scale-dependent evolution of perturbations. The authors seek associated features in simulations. A toy model explains a mechanism; hydrodynamic simulations test whether traces survive under more complicated conditions. Those are different kinds of evidence.
Then read the flux template. Observations contain spectra after neutral-abundance selection, velocity mapping, line-profile integration and instrumental processing. An empirical form connects velocity-related features to one-dimensional flux power and is fitted to simulations or observations. This bridge is not an exact identity: some template residuals in the paper reach roughly fifty percent.
Finally read Figure 8 alongside Table 2. Record the wavenumber coverage, free parameters and fixed simulation relationships at each redshift before interpreting a scale. This guide read all fifteen pages, eleven figures and both tables of this v1. The code and data offered on request were not acquired, and the hydrodynamic simulations were not independently rerun.
Reading: Iršič et al., Ringing of the Reionization, arXiv:2607.19938v1
Place observations and template peaks on the same axis
One-dimensional forest power commonly uses inverse velocity on its horizontal axis. The Boera data used in the paper reach about 0.2 inverse kilometres per second. The highlighted model features extend through approximately 0.1–1, with some example peaks near 0.8. The data do not enclose every such peak. Coverage determines whether a parameter is constrained by an observed peak shape or by the lower-wavenumber portion of an assumed template.
The paper also tests another observational covariance and finds little movement of the best fit. This does not remove template or instrumental uncertainties. Resolution treatment, errors and the maximum usable wavenumber still need inspection. No additional resolution correction from this study has been silently applied to the separate SDSS exercise.
Table 2 reports a pressure scale near 32.36 ± 8.35 comoving kiloparsecs at redshift 4.6 and 31.27 ± 18.28 at redshift 5.0, with an approximately 33.78 one-sigma lower limit at redshift 4.2. These conditional results come from the authors’ template fit. This guide reports them with their stated assumptions. Their fitting uncertainty does not automatically cover every model systematic.
Reading: Iršič et al., Ringing of the Reionization, arXiv:2607.19938v1
Use units to expose an unresolved convention
Converting wavenumber to length can hide a convention. An angular wavenumber gives a wavelength with ; a characteristic inverse-wavenumber length uses no such factor. Either definition is usable when carried consistently. The paper states a relation with , but this reading did not close the full correspondence between its velocity-wavenumber figure and comoving-length table.
Take an explicitly illustrative value, independent of the fitted points: redshift 4.6, Hubble rate about 501.82 kilometres per second per megaparsec, scale factor one divided by 5.6, and velocity wavenumber 0.35 inverse kilometres per second. Multiplying wavenumber by scale factor and Hubble rate gives a comoving inverse length. Its inverse is about 31.88 comoving kiloparsecs; including gives about 200.33. That difference is not rounding.
This example does not establish an error in the authors’ table. It identifies a definition that must be resolved before reproducing it. A number without happening to resemble a table entry is insufficient reason to drop that factor without explanation.
Reading: Iršič et al., Ringing of the Reionization, arXiv:2607.19938v1 · Independent hydrogen and sightline calculation materials
Leave with a testable next question
The claim can now be stated precisely: this preprint proposes a modelled signature of thermal-history-dependent velocity gradients in forest flux power, and fits a related scale under a specified template. It does not directly observe every gas parcel’s velocity field or separate thermal broadening, pressure history and dark-matter free streaming through that one scale alone.
A reproduction should first obtain the fixed template, fitting inputs, covariance and length definitions. After closing the units check, test how maximum wavenumber, instrumental processing and thermal-history assumptions move the answer. That creates a concrete investigation beyond retaining a “first direct measurement” headline.
The accompanying forward calculation prescribes density and velocity, then generates absorption. It does not evolve a pressure history and cannot independently validate this paper’s thermal-history scale. It explains velocity crowding as one link, allowing the reader to return to the paper and identify the remaining physical and observational steps.
Reading: Iršič et al., Ringing of the Reionization, arXiv:2607.19938v1 · Independent hydrogen and sightline calculation materials