Unpack the independent scientific materials
Download the scientific ZIP, compare its SHA-256, extract into a new directory and open a terminal there. The README records the actual tested environment: Python 3.9.6, NumPy 2.0.2 and SciPy 1.13.1. Record your own compatible versions too; final optimizer digits can change.
The package contains independent Python, own synthetic input, units and source identities. Its default workflow has no network access. It excludes the browser Engine, original papers, SPARC observations and measured-derived plots. Begin with the fully offline calculation below.
Reading: Independent saved-observation rotation-curve calculation
Save the observation before starting the fitter
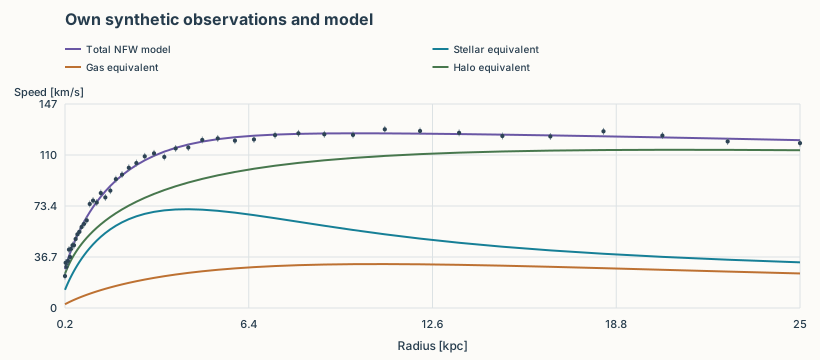
The first command generates 48 radii from thin exponential stellar/gas disks and a prescribed NFW field, adds the declared random noise and writes JSON. The generator reports its injection for provenance. The saved observation passed to the fitter has no injection parameters.
The second command opens that file and fits its observed speeds, errors and component columns. It does not read the generator’s truth. The NFW conditional optimum has mass-to-light ratio near , rather than the injected : noise has moved the optimum.
Each halo receives six starting points. Every stop status, objective value and function-evaluation count is saved. Several synthetic cored fits stop near , while another reaches . Both satisfy stopping conditions, so their actual objective values still need comparison.
python science/generate_observation.py --output results/own-observation.json
python science/analyze.py --input results/own-observation.json --output results/own-analysis
Reading: Independent saved-observation rotation-curve calculation
Recompute checks and figures from those saved results
The validator recalculates positive-density halo integrals, an independent ring-potential thin-disk reference, numerical distance/inclination derivatives and both likelihood-coordinate Jacobians. It also recomputes every saved predicted field and checks that the fit refers to the same input.
The output retains wrong-algorithm controls: treating the exponential disk as a sphere, subtracting nearly equal floating-point numbers and averaging a common error as though it were independent. Correct-method tolerances and failed controls are reported separately.
The plotter reads the saved observation and analysis to draw total speed, components, errors and conditional profiles. The published examples use our own synthetic data. Its poorer cored fit is a deliberate model-mismatch control for an NFW-generated fixture, not a test of real galaxies.

python science/validate.py --input results/own-observation.json --analysis results/own-analysis --output results/own-validation.json
python science/plot.py --input results/own-observation.json --analysis results/own-analysis --output results/own-figures
Reading: Independent saved-observation rotation-curve calculation
Acquire only the two fixed upstream products
The explicit online command below reads the official SPARC Table 1 and small Rotmod archive, a total of 138,996 body bytes. Exact sizes, SHA-256 and member CRC must pass before it extracts only NGC 2403. The other 174 members remain unextracted and unused. A changed identity stops acquisition without an automatic retry or mirror.
The author actually obtained both 200 responses into an empty directory on 5 November 2026. That fresh-acquisition receipt is separate from the subsequent offline cold-package replay. Future availability is established only by the reader’s own requests.
The fixed Table 1 body is 28,259 bytes and the archive 110,737 bytes. Complete hashes are in the package’s source metadata and downloader. The public material supplies the acquisition procedure; original products remain on the reader’s computer.
python science/fetch_named_source.py --online --http-budget-bytes 138996 --output local-sparcReading: Lelli, McGaugh & Schombert (2016), SPARC, AJ152,157 · Independent saved-observation rotation-curve calculation
Convert native columns into a traceable saved observation
NGC 2403 is the fixed quality 1, zero-bulge selection. Table 1 supplies and . The native component file has radii. Conversion checks hashes, the named 19-field metadata row and the no-bulge conditions before saving the observation.
The eight columns are radius, observed circular speed, speed error, gas equivalent speed, unit-ratio stellar speed, bulge speed, disk surface brightness and bulge surface brightness. Radii are in kiloparsecs; speeds are kilometres per second. The native error excludes inclination systematics and is not a complete covariance matrix.
A negative gas column marks the radial-force direction. Stellar columns retain the native finite-thickness model. This processed rotation-curve record is not the original two-dimensional velocity field; the procedure does not remeasure warps, noncircular motions or photometric deprojection.
python science/save_native.py --source local-sparc --output results/native-observation.jsonReading: Lelli, McGaugh & Schombert (2016), SPARC, AJ152,157 · Independent saved-observation rotation-curve calculation
Run the same optimizer and shared-geometry scenarios
The same analysis reads the saved real observation. Bounds are 0.05–1.5 for stellar mass-to-light ratio, 1000–10 billion solar masses per cubic kiloparsec for halo density, and 0.05–200 kiloparsecs for scale radius. This offline search is wider than the interactive demonstration, and those bounds remain part of the analysis.
Ten fixed stellar ratios each receive a new halo optimization. The nine common-geometry scenarios combine central and plus/minus one metadata-error distance and inclination. Every scenario is refitted. These are sensitivity calculations, not posterior samples or an assumed measured joint prior.
This actual rerun gives NFW stellar ratio about and scale ; the cored solution gives about and . Working reduced chi-square values are and . Both descriptions are poor at the supplied point-error weights. No selected point or original error is altered.
python science/analyze.py --input results/native-observation.json --output results/native-analysis
python science/validate.py --input results/native-observation.json --analysis results/native-analysis --output results/native-validation.json
Reading: Independent saved-observation rotation-curve calculation · Lelli, McGaugh & Schombert (2016), SPARC, AJ152,157
Generate measured-derived figures locally
The explicit option below acknowledges that the output contains local measured-derived figures. Use them on your computer to inspect radial residuals, parameter boundaries and coherent departures. Figures published with these chapters continue to use own synthetic observations.
Early development retained three failures: fixed-byte metadata slicing disagreed with the actual whitespace layout; NumPy booleans failed JSON serialization; and small-core subtraction plus a likelihood-coordinate auditor missed their original numerical gates. Corrected parsing/equivalent arithmetic and the earlier failures are documented separately. The package recomputes mathematical negative controls; a clean exit is not a certificate of every physical inference.
python science/plot.py --allow-local-observations --input results/native-observation.json --analysis results/native-analysis --output results/local-measured-figuresReading: Independent saved-observation rotation-curve calculation
Carry the checks to the next dataset
Record source identities and selection first. Check column units and signs, save observations, then fit. Compare starts and bounds; handle common geometry separately from point errors. Finally read the residuals alongside the physical and error assumptions that produced the score.
This workflow actually recalculates the fixed object’s conditional mass models. It supplies no particle identification, calibrated probability interval or complete original-velocity-field analysis. The next guide uses these habits to examine a newer paper’s changes of observations, assumptions and model comparisons.
Reading: Independent saved-observation rotation-curve calculation · Lelli, McGaugh & Schombert (2016), SPARC, AJ152,157