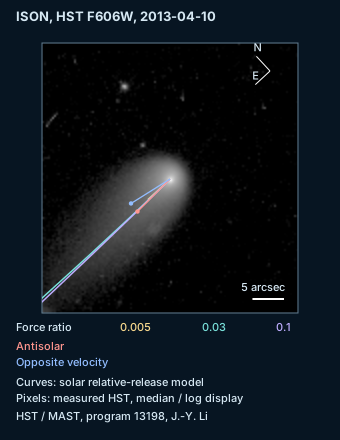
Download one observation, not a press-image date
Use HST/WFC3 F606W dataset ic7301ooq from program 13198, PI J.-Y. Li. Its single drizzled exposure began at UTC MJD 56392.21727116 and ended at 56392.22041947, with 272 seconds of exposure. The arithmetic midpoint is 2013-04-10 05:15:08.235216 UTC. That is the geometry epoch used here.
The frozen archive FITS was calibrated on 2026-06-01 with CAL_VER 3.7.3, dated Jan-07-2026. This processing date is distinct from the 2013 exposure and from any public-image release date. Li et al.'s original combined HST analysis used a different reduction and a longer observation sequence. We reproduce our declared single-frame diagnostic, not their full paper analysis.
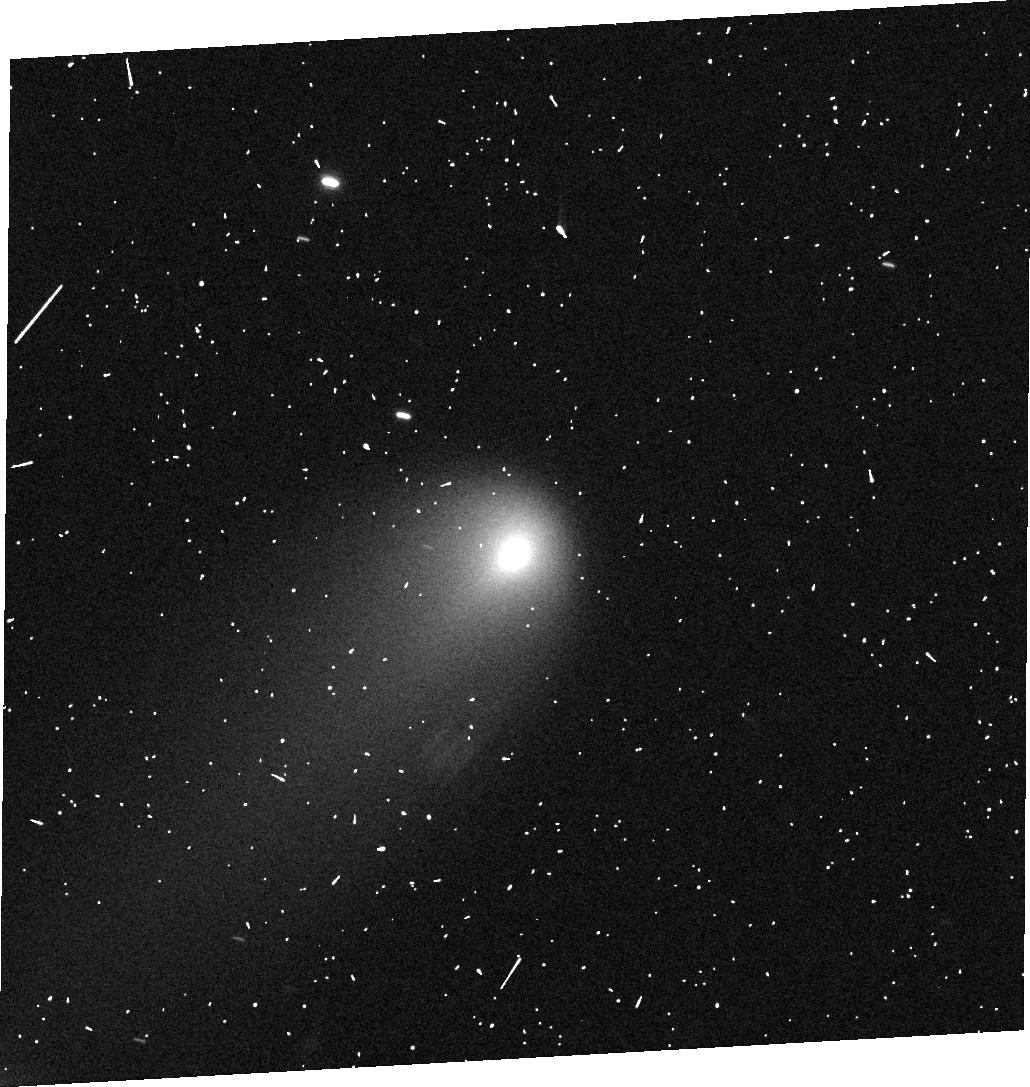
The source FITS is 13,579,200 bytes; its SHA-256 and direct MAST URL appear in the provenance download. MAST public-mission data use allows this scientific reuse with HST/MAST attribution. The untouched archive JPEG is linked beside the generated comparison figure. Neither image is a rendered Lab particle cloud.
Reading: MAST HST program 13198 and public data-use policy · Li et al.
Run the detached calculation
Create an empty directory, download the five required inputs and scripts, then run the command below. No site source, Lab Engine, Python packages or account are needed. The script verifies both input hashes before calculating and writes the complete numeric results plus an SVG whose grayscale pixels come from the measured image. The saved outputs used Python 3.12.14. Python 3.9 and later can replay the calculation; summation, math-library and PNG-compression differences may change final digits or file bytes across environments.
For the optional relative-force check, also download ison-perturbers.json and relative_release_reference.py and add --force-check. That step integrates the sampled differential planetary and nucleus-outgassing terms; it takes longer than the basic direction comparison. The reference output includes this step.
            mkdir ison-tutorial
cd ison-tutorial
curl --fail --remote-name https://sandboxphysics.com/stories/comet-dust/reproduce-ison.py
curl --fail --remote-name https://sandboxphysics.com/stories/comet-dust/comet_orbits.py
curl --fail --remote-name https://sandboxphysics.com/stories/comet-dust/svg_figure.py
curl --fail --remote-name https://sandboxphysics.com/stories/comet-dust/ison-image.json
curl --fail --remote-name https://sandboxphysics.com/stories/comet-dust/ison-ephemeris.json
python3 reproduce-ison.py --directory . --output result.json --figure comparison.svg
Reading: MAST HST program 13198 and public data-use policy · JPL Horizons API and observer/vector conventions
Put reception and emission on the right clock
Horizons observer quantity 30 gives TDB minus UTC as 67.185633 seconds at the exposure midpoint. Add that interval before querying TDB vector epochs. Observer quantity 21 gives the geocentric light time, 35.28174224 minutes. The comet is seen at an earlier emission epoch, while Earth is at the reception epoch.
All frozen vectors use ICRF axes and the FRAME reference plane. Comet release vectors are heliocentric, geometric and uncorrected for light time. To compare them with Earth at reception, form the observer position from barycentric Earth at reception minus barycentric Sun at emission. Subtracting a same-time heliocentric Earth without checking the moving origin would mix epochs. The reconstructed comet direction agrees with the separately queried light-time-corrected Horizons astrometric direction to the stored precision.
Reading: JPL Horizons API and observer/vector conventions · MAST HST program 13198 and public data-use policy
Use a relative release model with a matching parent
For each release state, propagate two solar conics: the grain under reduced gravity and a matching parent under ordinary solar gravity. Add their relative displacement to the JPL nucleus at the emission epoch. This is a solar relative-release approximation anchored to JPL geometry. It is not a full JPL dust trajectory.
The matching-parent subtraction matters. A solar-only parent released 120 days earlier misses the JPL nucleus by about 28,577 kilometres. Subtracting JPL directly would turn this parent-model mismatch into a false beta-zero dust tail. The relative construction returns exactly zero displacement when beta and launch velocity are zero.
The independent force check follows the actual daily JPL comet path and adds differential accelerations from eight planetary systems, together with the negative of the nucleus's unshared Marsden A1/A2 outgassing acceleration. Planetary acceleration has common and differential parts; nucleus outgassing is not automatically shared by dust. Over sixteen tested age/beta combinations, the largest offset change is 2.80 millionths and the largest position-angle change is 0.000074 degrees. Isolated nucleus outgassing changes the offset by less than 0.010 kilometres. These are sampled sensitivities, with step refinement, not a bound for all release parameters. Planetary multipoles, asteroid perturbers and relativistic terms remain outside this check.
Reading: JPL Horizons API and observer/vector conventions · Finson & Probstein · Burns
Map directions into native pixels without mirroring
Project the line of sight onto a tangent plane about the archived reference sky position. For a target direction q and reference east, north and centre unit vectors, the tangent coordinates are and . Convert radians to degrees, apply the inverse archived CD matrix and add CRPIX. The supplied script implements this full TAN projection.
FITS reference pixels are one-based. Native image rows increase along positive pixel y; only the display reverses rows. The archived CD determinant is negative, so copying a generic north-up, east-left shortcut into native pixel coordinates can mirror the result. Its positive image-y direction is −42.821 degrees east of north, agreeing with the archived ORIENTAT metadata.
As another orientation check, independently project the Sun–comet vector and negative heliocentric velocity and compare their position angles with Horizons quantity 27. They give 92.187 degrees and 79.277 degrees, respectively. A deliberately mirrored compass moves the measured tail peak from ninety degrees to about 185 degrees. The corrected JPL nucleus projects near native zero-based pixel (514.48, 528.54), consistent with the central source at this coarse scale.
Reading: MAST HST program 13198 and public data-use policy · JPL Horizons API and observer/vector conventions
Measure the broad tail and keep the alternatives
The frozen image input contains medians of finite, positive-coverage native eight-by-eight blocks, with the coverage fractions saved separately. Negative calibrated backgrounds remain in the file. This robust reduction suppresses isolated bright pixels; it is not flux-conserving aperture photometry. Choosing the brightest native pixel would pick pixel (201, 803), far from the nucleus.
Measure median brightness in twenty-degree-wide sectors on a five-degree angular grid. Four overlapping radial ranges, two–six, four–ten, six–twelve and eight–fifteen arcseconds, each peak at ninety degrees. These ranges test sensitivity to the chosen radius. They share pixels and correlated drizzle noise; four matching peaks are not four independent detections, and the grid spacing is not a formal error bar. The inner two arcseconds are excluded because the inner coma contains a sunward jet.
Compare two actual model outputs below. Thirty-day grains with beta 0.1 and sixty-day grains with beta 0.03 reach nearly eight arcseconds and point within about half a degree of one another. Both are compatible with this coarse broad-tail direction. A size or outburst date would require a brightness model, production history and additional observations. The calculation also uses a common emission epoch for all dust; the saved differential-light-time displacement estimate stays below ten kilometres for sampled points within fifteen arcseconds, sufficient for this coarse comparison but not a precision astrometric fit.
| Release age (days) | Beta | Separation (arcseconds) | PA east of north (degrees) |
|---|---|---|---|
| 30 | 0.1 | 7.92 | 91.558 |
| 60 | 0.03 | 8.58 | 91.007 |
| 120 | 0.005 | 4.79 | 90.081 |
| Observed sector peak | Several compatible | 2–15 tested | 90, on a 5-degree grid |
Reading: Li et al. · MAST HST program 13198 and public data-use policy · Finson & Probstein